Texas-based
Whole Foods (NASDAQ: WFM) on Thursday reported quarterly earnings that show
while the grocer is still growing, it's not growing as fast as it was a few
years ago — and investors aren't impressed, as shares fell 10 percent Thursday
upon the report.
But
Lakeland-Publix is already answering any potential threats from new
competitors, one analyst says.
"They’re
doing it, and they’re responding quite well to that," said David J. Livingston, principal of DJL
Research, a grocery industry consulting firm based in Wisconsin. "I think
they know what they have to do, and they’re doing it. Publix is a very
proactive company."
The real grocery battle, Livingston says, is for the middle
market — which Publix dominates in the Southeast. It has more than 1,100 stores
in eight states and took in a record $30.6 billion in revenue in 2014.
"Publix
is a middle-of-the-road grocer try to be everything to everybody,"
Livingston says. "What happened to Albertsons, to Kash n Karry? They’re
gone.Food Lion, gone. They’ve really destroyed that
middle of the road market."
Publix's
biggest competitor in that realm is Kroger Co. (NYSE: KR). While Kroger is yet to enter the Florida market—
aside from one store near the Georgia line, a byproduct of its Harris Teeter
acquisition — Kroger and Publix do go head to head in other key markets,
including Atlanta and the Carolinas.
Kroger
is much larger than Publix, with more than 2,000 stores in 31 states and fiscal
sales of $108.5 billion in 2014. Both are well-respected in the grocery world as premier
operators— and their competition has benefitted both grocers.
"They
can both win and share it, because everybody else lost," Livingston said.
"There have been a lot of casualties in their wake — there's a lot of
skeletal remains of grocery stores sitting around because of the battle Publix
and Kroger have waged."
Cold Supply Chain Technology Leader Promotes New Environmental Publication with Profits to Charity
Stunning Facts Behind the Obscenity of Wasted Food Revealed in Climate Change Book
US – WORLDWIDE – As a leader in the field of cold chain transport technology the Carrier organisation knows better than most the importance of preserving fresh food as it travels through the supply chain. Now the company is using that unique perspective on the global food system to highlight the stunning amount of food wasted globally and pointing out that, if food waste were a country, it would be the third largest emitter of greenhouse gases behind China and the United States. Carrier is publicising a cheap, easily accessible paperback which highlights the environmental obscenity which is discarded produce.
In the new 182-page book, called Food Foolish: The Hidden Connection Between Food Waste, Hunger and Climate Change, co-authored by John Mandyck, chief sustainability officer, UTC Building & Industrial Systems, and Carrier’s parent company, and Eric Schultz, former chairman and CEO ofSensitech, another UTC company specialising in cold chain monitoring and visibility, the case is made for the extraordinary social and environmental opportunities which could be created by wasting less food. As Eric Schultz points out:
“The very foods we need to address global nutrition and meet consumer demand are the most water-intensive and require the greatest protection along the supply chain. Their loss and waste not only intensifies hunger, but destroys our freshwater resources.”
One-third or more of the food we produce each year is never eaten. Meanwhile, more than 800 million people, a population equivalent to the United States and European Union combined, are chronically hungry. Food waste also has a devastating environmental impact. The embodied carbon dioxide emissions in food waste alone represent 3.3 billion tonnes. That’s the energy used to produce food that’s never eaten, including fuel for tractors used for planting and harvest, electricity for water pumps in the field and the power for processing and packaging facilities. In addition to greenhouse gas emissions, the water used to grow the food we throw away is greater than the water used by any single nation on the planet.
The impacts of food waste are magnified by our growing planet. The world’s population is expected to grow by another 2 billion people by 2050, with the added challenge of feeding more. Food Foolish was co-written by Mandyck and Schultz and features forewords from Philippe Cousteau, founder of EarthEcho International and Emmy-nominated television host, and Barton Seaver, explorer with National Geographic and director of the Healthy and Sustainable Food Program at the Center for Health and the Global Environment at the Harvard T.H. Chan School of Public Health. John Mandyck says:
“Hunger, food security, climate emissions and water shortages are anything but foolish topics. The way we systematically waste food in the face of these challenges, however, is one of humankind’s unintended but most foolish practices. We hope this book will be a catalyst for a much needed connected global dialogue on an issue that we believe is essential to the sustainability of the planet.
“We already produce enough food to feed 10 billion people, everyone today and those expected by 2050. We must implement readily available strategies to avoid food loss and extend food supplies, including energy efficient, sustainable and affordable technologies that better preserve food during transport and distribution, improved food safety standards and a change in consumer behaviour. When we waste less, we feed more. Without action, the low-hanging fruit for reducing climate change will continue to literally rot before our eyes.”
Why Do So Many Working Age Americans Choose Not To Enter The Workforce?
Via ConvergEx's Nick Colas,
Today we look at a unique dataset – Gallup’s annual poll of job satisfaction – to see what it can tell us about secular trends in employment, consumer confidence and spending. This annual survey of +1,000 people active in the U.S. workforce goes back to the late 1980s, so it is a useful lens with which to consider issues like labor force participation rates that have shifted unexpectedly over the period.
Most surprising news first: Americans express a broad satisfaction with their jobs, regardless of economic conditions. The very worst reading since 1989 was in 2011 when “Only” 83% of respondents said they were either “Somewhat” or “completely” satisfied with their jobs. The peak was in 2007 at 94%, and last year (August 2014) it was 89%.
The key takeaway is that declining labor force participation rates since the year 2000 (67% then, 62.6% now) aren’t because of any systemic disaffection with the American workplace.
The other notable takeaway: workers are (strangely, we must say) satisfied with what they earn. Those expressing “Complete” satisfaction with their paystub hit a high last year (31%) not seen since 2010 and 2006… Wage inflation? What for?
You could call it the “Mystery of the Missing Worker” – why do so many people of working age chose not to enter the workforce? Here are the numbers, as of the most recent Employment Situation report:
250 million: the total number of people of working age in the United States.
149 million: the total number of people in that population that have a job.
8 million: the number of people who want a job but do not have one.
93 million: the number of people who don’t work, and don’t want work.
To put some context around that last number, it is 30% of the entire U.S. population. This is the same as the current population of the entire West Coast (CA, OR, and WA) AND New York State AND Florida. Plus another 10 million people. Economists measure this with the Labor Force Participation rate, and it has been in decline since February 2000, when it peaked at 67.3%. It is now 62.6% and last month was a new low back to the 1970s. People of working age increasingly do not consider themselves part of the labor force. Most economists chalk this up to the demographics of an aging workforce even though virtually all the literature on the topic in the early 2000 predicted participation would continue to increase.
We recently took a long look at a dataset that doesn’t often see the light of day but does provide some useful takes on how workers view their jobs. It comes from the Gallup organization and is an annual survey of +1,000 employees since 1989 on their perceptions of job satisfaction in all its forms, from health and safety concerns to compensation to job security. The complete data set can be found here, and the charts below highight the trends...
But here are the important takeaways.
#1: Americans are consistently satisfied with their jobs, although the readings vary slightly through a given economic cycle. The highest ever combined responses of “Completely Satisfied” and “Satisfied” was in 2007 at 94%. The worst since the start of the survey in the late 1980s was 2011, at 82%. Last year – the results come out every August – the combined reading was 58% “Completely” and 31% “Somewhat” Satisfied, for a total of 89%.
#2: They also feel relatively secure in their positions. Last year some 88% reported being “Completely” (58%) or “Somewhat” (31%) satisfied by the security offered by their jobs and, implicitly, their employers. The worst readings were in 2009 at 80% total and in the early 1990s at 79%.
#3: Workers also report high levels of satisfaction with what they receive in terms of compensation. Back in 1991 – the worst year in terms of general reported satisfaction for this question – “only” 66% of respondents were completely or somewhat satisfied with their pay stubs. Even during the Financial Crisis and its aftermath that number troughed at 70% in 2011. Last year a total of 75% of respondents were satisfied with what they received for compensation.
#4: Workers who respond to the Gallup survey last year have the biggest gripes about health insurance benefits (only 61% satisfied), retirement planning (only 63% satisfied) and chances for promotion (68%).
#5: Conversely, workers reported exceptionally high levels of satisfaction in their relations with co-workers (95% completely or somewhat satisfied), physical safety (93%) and the flexibility of their hours (90%).
Frankly, when we started to look at these numbers we expected to see a mirror of the volatility common in consumer confidence surveys. A few points here:
Consumer confidence as measured by the Conference Board peaked in 1966/67 and again in the late 1990s at readings of +140.
Troughs occurred in the early 1970s, late 1970s/early 1980s and post September 11 at readings of 50 or so.
The Financial Crisis took us down to below 30 in 2008 and readings struggled to get past 70 until 2013.
We therefore thought that Americans would feel broadly the same about their work situations as they did the economy as a whole - that things are still pretty bad and the past was much better than the present. This turned out not to be the case. Yes, they express some marginal disaffection when times are hard, but the trough reading during and after the Financial Crisis was 83% satisfied with their jobs. Hardly a pitchforks and barricades kind of number.
In short, we can’t blame lower participation rates on the nature of work – broadly speaking – offered in the American economy. In Internet parlance, the American workplace gets 4 ½ stars and a lot of recommendations. Perhaps, in the words of Yogi Berra: “No one goes to that restaurant any more. It’s too crowded”.
This isthe painful reality in America: for increasingly more it is now more lucrative - in the form of actual disposable income - to sit, do nothing, and collect various welfare entitlements, than to work.
This is graphically, and very painfully confirmed, in the below chart from Gary Alexander, Secretary of Public Welfare, Commonwealth of Pennsylvania (a state best known for its broke capital Harrisburg). As quantitied, and explained by Alexander, "the single mom is better off earnings gross income of $29,000 with $57,327 in net income & benefits than to earn gross income of $69,000 with net income and benefits of $57,045."
We realize that this is a painful topic in a country in which the issue of welfare benefits, and cutting (or not) the spending side of the fiscal cliff, have become the two most sensitive social topics. Alas, none of that changes the matrix of incentives for most Americans who find themselves in a comparable situation: either being on the left side of minimum US wage, and relying on benefits, or move to the right side at far greater personal investment of work, and energy, and... have the same disposable income at the end of the da
Consumers of organic foods are getting both more and less than they bargained for. On both counts, it’s not good.
Many people who pay the huge premium—often more than a hundred percent–for organic foods do so because they’re afraid of pesticides. If that’s their rationale, they misunderstand the nuances of organic agriculture. Although it’s true that synthetic chemical pesticides are generally prohibited, there is a lengthy list ofexceptions listed in the Organic Foods Production Act, while most “natural” ones are permitted. However, “organic” pesticides can be toxic. As evolutionary biologist Christie Wilcox explained in a 2012 Scientific American article (“Are lower pesticide residues a good reason to buy organic? Probably not.”): “Organic pesticides pose the same health risks as non-organic ones.”
SAN FRANCISCO, CA – JUNE 13: A label stating ‘Produce of USA’ is wrapped around a bunch of organic carrots at a farmers market on June 13, 2012 in San Francisco, California. (Photo by Justin Sullivan/Getty Images)
Another poorly recognized aspect of this issue is that the vast majority of pesticidal substances that we consume are in our diets “naturally” and are present in organic foods as well as non-organic ones. In a classic study, UC Berkeley biochemist Bruce Ames and his colleagues found that “99.99 percent (by weight) of the pesticides in the American diet are chemicals that plants produce to defend themselves.” Moreover, “natural and synthetic chemicals are equally likely to be positive in animal cancer tests.” Thus, consumers who buy organic to avoid pesticide exposure are focusing their attention on just one-hundredth of one percent of the pesticides they consume.
Some consumers think that the USDA National Organic Program (NOP) requires certified organic products to be free of ingredients from “GMOs,” organisms crafted with molecular techniques of genetic engineering. Wrong again. USDA does not require organic products to be GMO-free. (In any case, the methods used to create so-called GMOs are an extension, or refinement, of older techniques for genetic modification that have been used for a century or more.) As USDA officials have said repeatedly:
Organic certification is process-based. That is, certifying agents attest to the ability of organic operations to follow a set of production standards and practices which meet the requirements of the Organic Foods Production Act of 1990 and the [National Organic Program] regulations . . . If all aspects of the organic production or handling process were followed correctly, then the presence of detectable residue from a genetically modified organism alone does not constitute a violation of this regulation.[emphasis added]
Putting it another way, so long as an organic farmer abides by his organic system (production) plan–a plan that an organic certifying agent must approve before granting the farmer organic status–the unintentional presence of GMOs (or, for that matter, prohibited synthetic pesticides) in any amount does not affect the organic status of the farmer’s products or farm.
Under only two circumstances does USDA sanction the testing of organic products for prohibited residues (such as pesticides, synthetic fertilizers or antibiotics) or excluded substances (e.g., genetically engineered organisms). First, USDA’s National Organic Production Standards support the testing of products if an organic-certifying agent believes that the farmer is intentionally using prohibited substances or practices. And second, USDA requires that certifying agents test five percent of their certified operations each year. The certifying agents themselves determine which operations will be subjected to testing.
The organic community, including theInternational Federation of Organic Agricultural Movements (IFOAM), supports the USDA’s lenient testing protocols and opposes more frequent mandatory testing of organic products for prohibited and excluded substances.
The organic community and USDA offer two explanations for such minimal testing. First, they emphasize that organic farming is process-based, not product-based, meaning that what counts for organic certification are the approved organic system (production) plan and the farmer’s intention to comply with that plan as reflected through record-keeping obligations.
Second, widespread testing would impose substantial costs on organic farmers, thereby increasing production costs beyond the already greater expenses that organic farmers incur. Organic farmers offset these higher productions costs by earning large premiums for organic products, but there is always a price point beyond which consumers will shift to cheaper non-organic.
Few organic consumers are aware that organic agriculture is a “trust-based” or “faith-based” system. With every purchase, they are at risk of the moral hazard that an organic farmer will represent cheaper-to-produce non-organic products as the premium-priced organic product. For the vast majority of products, no tests can distinguish organic from non-organic—for example, whether milk labeled “organic” came from a cow within the organic production system or from a cow across the fence from a conventional dairy farm. The higher the organic premium, the stronger the economic incentive to cheat.
Think such nefarious behavior is purely theoretical? Think again. USDA reported in 2012 that 43 percent of the 571 samples of “organic” produce that were tested contained prohibited pesticide residues, and that “the findings suggest that some of the samples in violation were mislabeled conventional products, while others were organic products that hadn’t been adequately protected from prohibited pesticides.”
How do organic farmers get away with such chicanery? A 2014 investigation by the Wall Street Journal of USDA inspection records from 2005 on found that 38 of the 81 certifying agents–entities accredited by USDA to inspect and certify organic farms and suppliers—“failed on at least one occasion to uphold basic Agriculture Department standards.” More specifically, “40% of these 81 certifiers have been flagged by the USDA for conducting incomplete inspections; 16% of certifiers failed to cite organic farms’ potential use of banned pesticides and antibiotics; and 5% failed to prevent potential commingling of organic and non-organic products.”
Speaking of trust and faith—or lack thereof–in organic foods, there was the example of holier-than-thou Whole Foods importing large amounts of its supposedly “organic” producefrom China, of all places. Those imports even included Whole Foods’ house brand, “California Blend.” (Yes, you read that correctly.)
Organic agriculture is an unscientific, heavily subsidized marketing gimmick that misleads and rips off consumers, both because of the nature of the regulations and cheating. The old saying that you get what you pay for doesn’t apply when you buy overpriced organic products.
Technomic Decodes Foodservice Consumers With Eater Archetypes by Technomic Posted: 2015-07-30 15:22:54 EST
CHICAGO -- Consumers are more complex than any trend piece in the media can portray about Millennials, Baby Boomers or other demographic groups. To understand these nuances and better serve their customers, restaurants and other foodservice brands must get beyond superficial demographic categories and begin studying the behaviors of their core consumers based on what they need, value and think. Technomic Inc. responded to this industry need for behavioral segmentation with its proprietaryEater Archetypes, which break new ground for turning psychographic data into business insights.
In the Chicago-based firm's latest white paper, the Eater Archetypes reveal how psychographic factors can sway consumers with the same age, income or demographic profile toward different foodservice choices:
Foodservice Usage: Some segments are particularly valuable to foodservice operators. Specifically, Busy Balancers and Functional Eaters, who rely on foodservice to fuel their on-the-go lifestyles, strongly drive foodservice usage at restaurants and convenience stores.
Brand Patronage: Different needs and lifestyles cause certain Eater Archetypes to gravitate toward different brands. Health Enthusiasts over-index for visiting Subway compared with other limited-service restaurants, while Bargain Hunters show an outsize preference for Burger King, and Habitual Matures over-index for McDonald's.
Occasion Dynamics: The consumers patronizing a restaurant likely vary by occasion and daypart. For example, afternoon snack occasions and visits with children skew to Busy Balancers, while Functional Eaters drive late-night visits.
"Surface-level demographics aren't enough to help brands drive lasting success anymore, and the Eater Archetypes were designed to help companies truly get their key customers and cut right to what would serve those consumers better," said Sara Monnette, vice president of Technomic and leader of the firm's Consumer Insights practice. "By understanding consumers' interests, opinions, behaviors, lifestyle preferences and habits, brands will be in a better position to understand how their target consumers would respond to new initiatives and products."
After more than a year of development and testing, Eater Archetypes were integrated into Technomic's Consumer Trend Reportseries in 2014 and into Consumer Brand Metrics in 2015. Chain foodservice brands can partner with Technomic for their own Eater Archetype assessments, in which the brand can identify which EAT segments make up its core users, compare those findings to the brand's competitive set, and design new offerings that align with what its customers need to fit the brand into their lifestyles.
It’s Amazon’s World. The USPS Just Delivers in It
The U.S. Postal Service has become an extension of Amazon and is courting other e-commerce giants
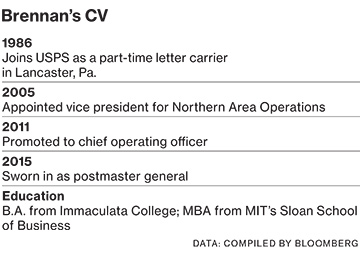
In cities such as San Francisco and New York, letter carriers have been showing up on people’s doorsteps as early as 3 a.m. bearing unusual cargo: milk, eggs, and other perishable items. The U.S. Postal Service has been delivering groceries to customers of Amazon.com in selected areas since October 2014. “It’s just leveraging our infrastructure,” says Megan Brennan, who was sworn in as America’s 74th postmaster general in March, becoming the first woman to hold the job in the institution’s 240-year history. “We’re on people’s doorstep six days a week, seven days a week in some cases. It’s just a logical progression.”
A former letter carrier from Pottsville, Pa., Brennan is trying to transform the USPS into a delivery service for the e-commerce era. That means hauling fewer letters and more packages. It means showing up with them at once-unheard-of hours and even on Sundays. “Amazon is the first,” Brennan says. “But we’re obviously looking to get additional customers who are interested in that type of customized delivery.”
Brennan’s predecessor, Patrick Donahoe, announced in November 2013 that the Postal Service would do deliveries for Amazon seven days a week. Since then, the Seattle giant has assembled a network of more than 15 facilities where it sorts packages it then trucks to nearby post offices, so letter carriers can take them the rest of the way. Amazon said in a recent regulatory filing that it plans to build more of these sorting centers this year.
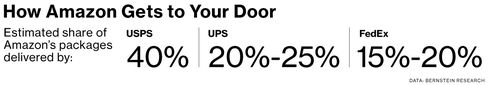
The USPS doesn’t disclose much about its relationship with Amazon, citing confidentiality agreements. Amazon didn’t respond to several requests for comment. David Vernon, an analyst at Bernstein Research who tracks the shipping industry, estimates the USPS handled 40 percent of Amazon’s volume last year—or almost 150 million items—more than either United Parcel Service or FedEx. He figures that Amazon pays the USPS $2 per package, which is about half what it would pay UPS and FedEx. Vernon says Amazon receives a deep discount from the USPS because the e-tailer does so much of its own processing—including providing computerized address lists to make it easier for carriers to tailor their delivery routes for faster drop-offs. “I think [Amazon’s] idea was, why give this volume to FedEx when we can just sort it ourselves?” Vernon says. “Because it’s not that hard.”
Brennan needs all the new business she can get. In 2014 first-class mail volume fell 3 percent compared with the previous year, to 64 billion pieces. Advertising mail, which some people refer to as junk mail, remained essentially unchanged. But the USPS’s package volume climbed 8 percent from the year before, to 4 billion items, and accounted for 20 percent of the agency’s $68 billion operating revenue.
Yet as its package volume rises, the USPS has had to invest in new equipment. Last year it spent $200 million to furnish its carriers with 270,000 Internet-connected handheld scanners made by Honeywell that enable them to provide real-time package tracking. “The Postal Service is far more technology-centric than most people would understand or believe,” Brennan says. The agency is also hoping to replace its fleet of 189,750 delivery trucks, most of which are 25 years old and not configured to hold packages. The USPS Office of the Inspector General estimates this will cost more than $5 billion.
These expensive upgrades come at a time when the USPS is essentially broke. It expects to lose $6.1 billion this year and as of late March had only $6 billion in cash, enough to keep running for 22 days. Brennan has been quietly calling on various political leaders and special-interest lobbyists in Washington whose support she needs to fix her troubled agency. A top priority: getting Congress to pass legislation that would require USPS retirees to use Medicare as their primary health insurance. This would eliminate the need to pay $5 billion a year to fund future retiree health benefits, as the agency is now required to do by law. It hasn’t been able to make the payments since 2011.
The USPS’s package growth gives Brennan something more pleasant to discuss with lawmakers and lobbyists than the inexorable decline of first-class mail. Even conservative Republicans, who object to proposals championed by U.S. Senator Elizabeth Warren (D-Mass.) and others for the USPS to get into new businesses such as banking, want to see the agency deliver more e-commerce-generated boxes. “Nobody ever said they shouldn’t be delivering packages,” says Jason Chaffetz (R-Utah), chairman of the House Committee on Oversight and Government Reform, which oversees the USPS.
Postal union leaders, who don’t always see eye to eye with management, are similarly enthusiastic. “We’ve been trying to get the Postal Service to do this kind of thing for years,” says Brian Renfroe, director of city delivery for the National Association of Letter Carriers.
The USPS says it’s making Sunday deliveries for other companies, which it refuses to name. But it may be a while before Brennan lands another client as big as Amazon, which, besides the sorting centers, has 50 enormous distribution warehouses across the U.S. “The only company in America right now that has so many distribution centers purely for e-commerce is Amazon,” says Marc Wulfraat, founder of MWPVL International, a logistics consulting firm in Montreal. “Wal-Mart’s probably the next-biggest player with, say, six or seven, and it drops off real fast after that.”
In the meantime, the USPS is tethered to Amazon, a company that isn’t just a customer—it’s also a competitor. In cities such as New York and Washington, where the USPS is testing same-day delivery, Amazon offers a similar service. The e-tailer has its own AmazonFresh grocery delivery trucks. And it’s seeking permission from the Federal Aviation Administration to make deliveries using aerial drones. Given its gargantuan ambitions, Amazon could even recruit its own army of delivery people. But Brennan isn’t concerned about that. The last thing Amazon Chief Executive Officer Jeff Bezos probably wants to do now after building all those sorting centers is hire more than 300,000 men and women to carry packages like the USPS. Even in the age of Amazon, that’s the Postal Service’s undeniable edge.
The bottom line: The U.S. Postal Service handled an estimated 40 percent of Amazon’s deliveries in 2014.

 US – WORLDWIDE – As a leader in the field of cold chain transport technology the