Sunday, July 31, 2016

Even on Food Issues, Politics Divides Americans

Laura Kubitz (kubitz@ific.org)
Matt Raymond (raymond@ific.org)
WASHINGTON, DC – The ideal presidential candidate is not the only thing Americans have a hard time agreeing on. An ideological rift exists on certain food issues too.
The International Food Information Council (IFIC) Foundation’s 2016 Food and Health SurveyConsumer Attitudes Toward Food Safety, Nutrition & Health examines how consumers differ in their attitudes on food issues. The results show that conservatives and liberals differ in their attitudes toward sustainability, trust in government for food-related information, and their top food safety issues.
“The 2016 Food & Health Survey marks the 11th edition of an ongoing investigation into the beliefs and behaviors of Americans,” said Kimberly Reed, President of the International Food Information Council Foundation.
“We are seeing a growing national food dialogue, and Americans are hungry for more information about nutrition and the food system,” Reed said. “The 2016 Survey, which includes a special focus on understanding the complex array of factors that influence food decisions, provides important insights and trends for health professionals, government officials, educators, as well as others who seek to understand and improve the health of all Americans.”
Sustainability
Consumers approach sustainability from different angles. Liberals more readily cite the importance of environmental aspects of sustainability, while conservatives are drawn to sustainability for economic reasons.
For example, conservatives believe that conserving farmland over multiple generations (41 percent) and ensuring affordability of the food supply (47 percent) are the most important aspects of sustainability, while liberals cite reducing carbon footprint (22 percent) and conserving natural habitats (51 percent).
Both conservatives and liberals agree overwhelmingly that it is important for food products to be produced sustainably. However, liberals (56 percent) are much more likely than conservatives (35 percent) to say that they would pay more for sustainably produced products.
Media Influence
Media might play a role in these ideological differences. Liberals and conservatives differ in their exposure to books, articles, and documentaries that examine the food system.
Over half of liberals (51 percent) have read an article examining the food system in the past year, while about one-third (31 percent) of conservatives reported doing the same.
Similarly a much larger proportion of liberals (27 percent) report seeing a movie or documentary that examined the food system in the past year, compared to conservatives. (13 percent).
Trust in Government
Conservatives and liberals have different levels of trust in the government on food issues.
Liberals are more likely than conservatives to cite the government as a top source of trust for information on the safety of food and ingredients (58 percent vs. 46 percent).
Only about one in four (27 percent) conservatives highlighted the government as a top source of trust for information about the types of food you should eat, while nearly half of liberals (48 percent) highlight the government as a top trusted source for this information.
Food Safety
Liberals and conservatives also differ in what they view as the top food safety issues. “Foodborne illness from bacteria” ranked first among both liberals and conservatives (55 percent and 58 percent respectively). However, liberals are far more likely to cite “pesticides” as a top food safety issue (38 percent vs. 24 percent), while conservatives are twice as likely to cite “carcinogens or cancer-causing chemicals in food” (40 percent vs. 20 percent).
Those who identify as somewhat liberal (12 percent) are twice as likely as those who are somewhat conservative (6 percent) to cite “food additives and ingredients” as a top food safety issue.
The results are derived from an online survey of 1,003 Americans ages 18 to 80, conducted March 17 to March 24, 2016. Results were weighted to ensure that they are reflective of the American population, as seen in the 2015 Current Population Survey.  Specifically, they were weighted by age, education, gender, race/ethnicity, and region. The survey was conducted by Greenwald & Associates, using ResearchNow’s consumer panel.

Friday, July 29, 2016

Supply Chains to Admire: 2016 Results

sc-to-admire-2016-general_miniFive months of analysis. Lots of heated debates. It is now over. This morning we announced the Supply Chains to Admire Winners and Finalists for 2016. The research starts in April and stretches over many weeks as we analyze the different elements and understand the patterns of each industry.
Why do we do it? Selfishly, we need a standard for our research, but we also want to help supply chain leaders gain new insights from a deep data-driven analysis. There is no agreed-upon standard for supply chain excellence. Leaders agree that it is easier to say than define. A clear goal is needed to drive progress. The answer? We think deep research to help companies determine benchmarks and set goals.
Background.
The Supply Chains to Admire analysis is now in its third year. It is data driven research: a deep analysis of performance, improvement and Price to Tangible Book Value of 320 companies across 31 industries for the period of 2009-2015. The source data for the analysis is public reporting of balance sheets and income statements.
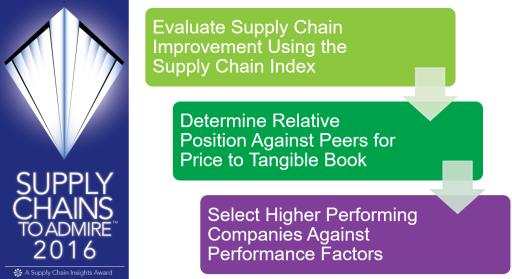
To determine the winners, we compare the effectiveness of each company against relative performance within an industry-specific peer group. We determine which companies have driven higher levels of improvement (based on Supply Chain Index calculations) and shareholder value (as defined by Price to Tangible Book Value) while outperforming their peer group on growth, operating margin, inventory turns and Return on Invested Capital (ROIC).
Figure 1. Supply Chains to Admire Methodology
flows
The Results
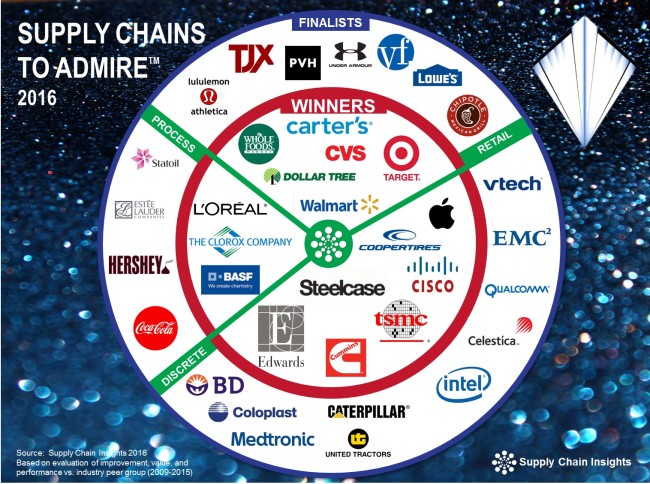
In the analysis, we divide companies into three groups: winners, finalists and under-performers.
  • Winners. The winners of this analysis meet all of the criteria of improvement, value and performance when compared to a like industry peer group. Sixteen companies qualify against this criterion. This is a high-performing group representing 5% of public companies studied.
  • Finalists. A finalist drove higher levels of improvement, and value, and are within 10% of the industry average on three out of four of the performance factors, and no more than 25% below the mean on any of the four factors of growth, operating margins, inventory turns and ROIC. Twenty-one companies meet this criterion. In this analysis, 7% of companies studied are finalists. The combination of finalists and winners equals 12% of companies studied.
  • Underperformers. The winners and finalists are an elite group. 88% of companies do not meet the three criteria of improvement, value or performance. Unfortunately, we find most companies are moving backwards on the Supply Chain Metrics That Matter™ or making progress on singular metrics versus driving performance improvement on a balanced portfolio of supply chain metrics that correlate to market capitalization. (If you see one of my presentations, I am sure that you remember the gnarly patterns of the orbit charts.) This includes industry icons that are often referenced as best-in-class supply chains. (When you hear an industry consultant speak of a top performing supply chain, trust but verify. Check out their performance by plotting year-over-year metrics at the intersection of two ratios and look at the patterns. We find the patters and the intersection of inventory turns and operating margin and growth and Return on Invested Capital (ROIC) to be insightful.)
Figure 2. Results of the Supply Chains to Admire Analysis
2016 Supply Chains to Admire Winners and Finalists 2009-15
There are no winners or finalists in the industries of aerospace & defense (A&D), automotive, automotive suppliers, conglomerates, consumer durables, ecommerce retail, hospitals, over-the-counter drugs (OTC), packaging, pharmaceutical, third-party logistics or toy industries. Similarly, industries like beverages, contract manufacturing, food, oil & gas, restaurants and fast food, and retail apparel have finalists, but no winners. We find it ironic that the industries with the greatest challenges—high-tech & electronics—post the greatest progress, while industries with slow market shifts—household products, food, and beverage—are regressing. 
What Drives Value?
In the report, we wanted to determine which factors correlate to Price to Tangible Book Value (PTBV). We wanted to answer the question of, “What Should Supply Chain Leaders Do to Drive Value?”
As a part of this analysis, we wanted to answer the question for supply chain leaders on what drives value. To answer this question, in parallel with the Supply Chains to Admire research, we mined our quantitative data to answer the question of, “What steps should companies take to improve PTBV?”
In the analysis of the Supply Chains to Admire, we use PTBV as a proxy metric of value. We believe that improving the value of shares outstanding in relationship to assets and tangible book value is within the control of the supply chain leader. The definition of PTBV is:
Price to Tangible Book Value = Market Share Price / Tangible Book Value/Shares Outstanding
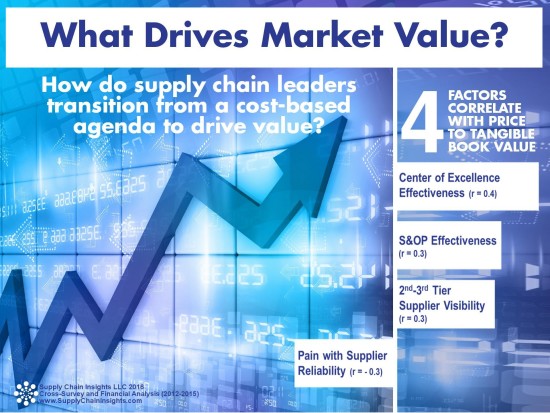
To help the supply chain leader reading this report, we wanted to use our survey database to understand the relationship between strategies/process options and improving PTBV. (Through this analysis, we find that companies that have a successful Supply Chain Center of Excellence, an effective S&OP process, and have less business pain with supplier reliability drive greater PTBV performance. In the spirit of transparency, in Figure 3, we include the correlations of these factors to PTBV.  In addition, factors considered, but had a correlation less than r=0.30 and greater than -0.30 are included in the full report. Check it out! As many commonly held factors, like a single instance of ERP, do not show a pattern of correlation to PTBV.
Figure 3. Steps to Take to Improve Price to Tangible Book
price-to-tangible-book-2012-15-infographic2
What Can We Learn from the Research?
When we interview companies making the Supply Chains to Admire list, we find commonalities and similar patterns. These are shown in Table 1.
Table 1. Characteristics of Supply Chains to Admire Leaders
characteristics of the Supply Chain to Admire winners
These companies have longer tenure of their leadership teams with a focus on long-term outcomes. In addition, there is consistency in direction. The teams sidestep fads with a dogged focus on supply chain excellence.
Complexity hampers results. In our analysis, we also find that these companies are more focused on the management of complexity through the adoption of customer segmentation, cost-to-serve analysis and item rationalization. They are better  at horizontal processes, supply chain planning and network design (form/function of inventory).
Over the course of the next six months, we will be sharing case studies of these companies in our conferences, podcasts, webinars, and writing. We want to raise the level of discussion on supply chain excellence and get out of the trap of blindly defining legacy processes as “best practices.”
For details check out the full report on Supply Chain Insights. Winners will be featured on the podcast Straight Talk with Supply Chain Insights and at the Supply Chain Insights Global Summit on September 7-9, 2016 in Scottsdale, AZ. We  hope to see you there! Please join me in congratulating the top 12% of supply chains that are driving improvement, value and higher levels of performance on the Supply Chain Metrics That Matter.

The future of vegetables is ugly

  
The future of produce is ugly. Twisted, blemished, mutated and deformed, to be specific.
That’s because an increasing number of grocery chains and crop-sharing services have begun stocking and distributing fruits and vegetables that were once deemed unfit for sale based solely on appearance. To be clear, these goods aren’t damaged or rotten or distasteful. If a chef chopped them up and served them in a souffle, most would never know the difference. Their banishment from shelves was purely produce prejudice.
In recent years, a small number of eco-conscious consumers have begun buying imperfect produce, often at discounted prices, in an effort to chip away at the planet’s staggering level of food waste. Now, the buy-ugly movement has been thrust into the mainstream. Walmart, the nation’s largest grocer with more than 4,000 produce-selling stores, announced last week it would sell less-than-pretty apples in 300 stores across Florida. This builds on an ugly potato program the retail behemoth launched in Britain earlier this year.
By virtue of its size, when Walmart makes a change, the broader retail sector notices. The company commands a massive and global supply chain and possesses tremendous purchasing power, a combination that allows it to disrupt traditional distribution channels and create demand for products where there once was none. And food is big business for Walmart. Groceries accounted for 56 percent of all sales in the company’s U.S. stores each of the past three years, according to Securities and Exchange Commission filings.
Walmart’s program “is a result of working with our suppliers to build the infrastructure and processes that create a new home for perfectly imperfect produce,” Shawn Baldwin, Walmart’s senior vice president for global food sourcing, produce and floral, wrote on the company’s blog. “Because ugly produce can occur unexpectedly in any growing season or crop, we want to have the systems in place to offer this type of produce whenever it may occur.”
Walmart is hardly alone in its embrace of ugly fruits and vegetables. Whole Foods has sold similar goods in the past, but it does not have the mass market reach of Walmart. And getting U.S. consumers to buy flawed produce has not been easy. Shoppers, particularly Americans, have long fixated on food with visual appeal in addition to (or instead of) nutritional value. There’s a reason the food that appears in television and magazine advertisements look like modern still-life paintings, meticulously crafted by professional stagers to the point of defying reality.
European shoppers, by contrast, have been pioneers in food conservation and buying ugly. Britain has conducted a “Love Food Hate Waste” campaign since at least 2007, and the European Union has pledged to cut its food waste in half over the next decade. Winning acceptance for ugly produce is just one tactic being pursued in Europe to meet that goal. Others see a moneymaking opportunity; a grocery store in Denmark called WeFood sells only discounted food that is either misshapen or past its stated expiration date.
Our vanity contributes to America’s waste epidemic. No matter how you slice it, the United States throws away tons of edible food every year. The Natural Resources Defense Councilestimates that 40 percent of food grown and produced in the United States each year goes uneaten. More fruit and vegetables are wasted than any other food category, with 52 percent being lost rather than consumed.
There are many factors that lead to this waste. Some food may simply spoil before it’s sold or fail to meet standards set by the Agriculture Department for consumable goods sold in the United States. Retailers also have guidelines for produce they are willing to shelve, and those guidelines are often more stringent than the government regulations.
For its part, the food industry has made efforts to eliminate some of this waste by selling misshapen produce as ingredients in other foods, said Kathy Means, vice president of industry relations at the Produce Marketing Association. Strawberries may be mashed into jam, for example. Baby-cut carrots were invented in 1986 as a way to repurpose full-size carrots that weren’t considered grocery-store caliber.
“It still is a huge challenge to get people to understand that ugly fruits and vegetables are perfectly fine to eat, and that it’s good for our planet,” said Evan Lutz, the chief executive of Hungry Harvest. Founded in 2014, the company makes weekly shipments of store-rejected produce to homes around the Mid-Atlantic.
And when the package arrives, the contents don’t always look like a middle school science project. Sometimes perfectly normal produce can be rejected by stores for logistical reasons, and could wind up in a landfill if not for alternative sellers such as Hungry Harvest. “People are really surprised often times when they get their box [of ugly produce]. It’s really the same stuff you would find in the grocery store,” Lutz said.

New study reveals UK new product launches has fallen by 13%

28 July 2016  •  Author(s): Stephanie Anthony, Editor New Food
Supermarket-Fines
The number of new products being launched by manufacturers into UK retail stores is falling significantly, according to a study of the performance of new grocery products from launch, published by IRI, a leading provider of FMCG market intelligence and predictive, actionable insight.
As major retailers like Tesco cut their ranges to remove slower selling items, resulting in 1,000 fewer packaged grocery items on shelves (a drop of 6.3%), the study shows that 13% fewer new branded items were launched in 2015 compared with 2013.
IRI’s 2016 New Product study shows a drop in the number of new products launched in both food and non-food categories. The number of new private label items launched also fell, but twice as quickly – by 26%. This trend is continuing into 2016, with the rate of new product innovation falling further.
According to IRI, first year sales of branded NPD contributed just 2% to overall sales in the UK across 2014 and 2015, down from 3% (based on a similar study of new products by IRI in 2011). While NPD is recognised as a key driver in category growth, encouraging consumers to trade up at a premium price, there were less new branded items launched across food and non-food sectors.
“As UK retailers look to rationalise their ranges, new products are finding it harder and harder to get listings. At the same time, however, suppliers are producing fewer new products, largely due to budgetary pressures brought about by massively high trade promotion costs and squeezed margins as market prices drop,” comments Tim Eales, author of the study and Director of Strategic Insight at IRI.
“We are also seeing new products not being supported by trade promotions as much as they used to be, which is contributing to their price premium having increased and, arguably, negatively impacting rate of sale. Delisting is happening more often and more rapidly under the scenario of more aggressive range management by retailers. All of this culminates in a big drop in the contribution of NPD to overall grocery sales, a serious concern given that it is recognised as the lifeblood of an industry that is struggling to cope with a number of serious challenges.
He adds: “NPD has the potential to give UK retailers, such as Tesco, Asda, Sainsbury’s, Morrison’s, Co-op and Waitrose, a competitive advantage versus their discounter competitors who have limited SKU ranges, as they offer new news and increased choice to shoppers. The key question our study raises, however, is whether manufacturers and retailers can find a way to collaborate and champion the right innovative NPD, whilst managing range reduction agendas. If they get this right, NPD can continue to be a differentiator for all parties.”
IRI’s study also shows that new products are finding it harder to achieve distribution in multiple retailers. On average, the maximum distribution achieved by new products in multiple retailers in the latest study was 44%, 5 points lower than when IRI measured it in 2010/11. It was 3 points lower for food products and 9 points lower for non-food products.
According to IRIs Tim Eales: Achieving good distribution is essential to maximise sales of new products, but this is getting harder and harder to do. To be successful with new product development, manufacturers will often aim for 75% distribution within 12 weeks. In fact, what were actually seeing is that only 1 in 20 new launches achieve this target in multiple retailers, and only 1 in 7 ever achieves that level of distribution at any point in their life. It seems that as retailers concentrate on reducing range, it has become more difficult to grow distribution for new products.

Is New Extreme Value Grocery Store Latest Biz Disruptor?


A new player has entered the value super market business.
A NEW PLAYER HAS ENTERED THE VALUE SUPERMARKET BUSINESS. 


Will discount grocery stores like ALDI, Costco and Sam’s Club soon be facing some serious competition?
Well, that’s what LogicLane, a new startup that offers discount wholesale groceries on its eCommerce marketplace, is certainly hoping. LogicLane recently opened its online marketplace to consumers and businesses after first beta testing it with an invitation-only period and can now connect customers to everything from a box of cereal to an entire pallet of cases of cereal boxes (the company is offering free shipping on orders over $1,000 in an effort to get customers to purchase larger orders).
The company also opened its first brick-and-mortar location, called Mill Street Merchants, in Uniontown, Pennsylvania, both as a way to expand its brand presence and to offer the solution of an affordable grocery store in a town not serviced by very many options.
Mill Street Merchants opened in early July after John Gabriel Sr., a 27-year veteran of the retail fashion business, decided he wanted to take on and (hopefully) shake up the wholesale food industry, according to Pittsburgh Post-Gazette.
Gabriel gathered together an experienced group of merchants, former execs at national discount retailers, technology entrepreneurs, venture-backed tech companies and financial sector firms, to build the LogicLane and Mill Street Merchants team to compete in this new retail sector.
“Our Mill Street Merchants business model is simple,” Patrick Esposito, chief executive officer at LogicLane and Mill Street Merchants, recently told Grocery Headquarters. “Tons of great food gets lost in the distribution cycle and goes to waste. Mill Street Merchants helps to eliminate food waste by finding groceries at huge discounts and then passing these extreme discounts onto our customers — both businesses and consumers. Anything that doesn’t get purchased quickly at Mill Street Merchants or online at LogicLane.com gets donated to local charities for use.”
As a brick-and-mortar grocery store — which LogicLane execs have repeatedly stated they plan to open more of — Mill Street Merchants is definitely light on frills but high on value.
The 6,000-square-foot grocery store sells wholesale foods to its customers at a discount of up to 30–70 percent off. The Uniontown store is already stocked with about $100,000 worth of food, although the store keeps nothing in backstock so products move from the shelf — where easy-to-read signs make prices very visible — to a customer’s cart to out the door in a hurry.
“Mill Street Merchants specializes in finding products that are outside of the normal retail distribution process to bring extreme values and amazing deals to customers and, in the process, help to stop food waste,” Gabriel said.
Shoppers at the Pennsylvania store have gotten discounts on everything from a $0.99 tub of Heinz yellow mustard to a $24 case of Slim Jims, while items that are near their expiration date are simply given away for free at the register with purchases.
“We’re not pretty, but I don’t think people will mind jumping over boxes [for a deal],” Gabriel told Pittsburgh Post-Gazette when the paper covered the store’s opening on July 13.
According to a study by the Natural Resources Defense Council, more than 40 percent of the U.S. food supply simply gets wasted and never consumed, which adds up to a disturbing $165 billion annually in wasted food. “Inefficient” distribution and delivery models account for about $40 billion in wasted food in the distribution process between producers, distributors and retailers, which is the model that LogicLane and Mill Street Merchants are targeting with the new venture.
“Mill Street Merchants has a team of experienced food merchants that sources high-integrity, brand name food and beverage products at opportunistic prices from trusted manufacturers and distributors,” Gabriel told Grocery Headquarters.
LogicLane/Mill Street Merchants is certainly an intriguing and innovative business model to keep an eye on, and it should be interesting to see how some of the major value grocery store brands — like ALDI and Costco — react to its presence in the marketplace.
It also should be interesting to see how consumers and even restaurants — who theoretically could use LogicLane as a way to drastically reduce some of their food supply costs and curb excess waste — will react to this new marketplace that lets them purchase food at a steep discount.
If there’s anything the market’s data has been telling us recently, it’s that customers are hungry for a deal or a bargain like never before.
Cheap fast-fashion products have uprooted the model of the traditional American shopping mall, a new study found that the majority of shoppers — about two-thirds — are now making their retail apparel purchases at off-price retailers and outlets, and the private-label or store brand food industry has turned into a booming $118.4 billion annual business that even eCommerce giant Amazon is eager to take a crack at.
In a sea of bargains for consumers as far as the eye can see (slight pun intended), a new player appears to have just waded into the game.